05 · Concept · 2024
Enterprise CRM Dashboard
Pipeline-first sales operations interface
- Concept
- B2B SaaS
- Sales operations
Overview
A CRM dashboard designed around how sales teams actually work.
The problem
Sales teams need speed and depth at the same time. The goal was to support quick scanning, deeper investigation, and immediate action without unnecessary context switching.
My role
- Product Designer focused on sales workflow mapping, information architecture, dashboard and interaction design, AI insight presentation, task states, visual hierarchy, and reusable UI patterns.
Context
Sales teams move between performance checks, customer conversations, follow-ups, and deeper investigation, so the interface needed to support different levels of attention without becoming overwhelming.
Challenge
Competing priorities
Sales teams need both speed and depth. Most interfaces force them to choose one.
Information relevance
What matters depends on the moment. The interface needs to surface the right context at the right time.
Actionability
Insight is only useful when it leads to a clear next step.
Approach
- 01
Prioritize the daily workflow
- 02
Create a clear information hierarchy
- 03
Keep actions close to relevant information
Key UX decisions
- Problem
- Sales teams are flooded with signals and context.
- Decision
- Prioritize signals over noise; show the most relevant information first and keep the rest available without creating clutter.
- Why it mattered
- Scanning should be fast, while deeper investigation stays available when needed.
- Problem
- Most CRM interfaces make users choose between speed and depth.
- Decision
- Scan first, investigate second.
- Why it mattered
- Users can move from quick review to detailed context without context switching or lost momentum.
- Problem
- Key actions are often too far from the information they support.
- Decision
- Keep actions close to the relevant information.
- Why it mattered
- Decision-making becomes faster when action and evidence are visually connected.
User flow
- 01
Open CRM
Start with the current workload
- 02
Scan key signals
Review performance, risks and priority items
- 03
Identify what needs attention
Spot what deserves action
- 04
Review details
Inspect call context, customer information and insights
- 05
Take action
Update tasks or move to the next step
- 06
Follow up
Close the loop with the customer
Design system
Reusable patterns for KPI cards, charts, status indicators, insight cards, filters, task actions, priority states, and core visual foundations.
- KPI cards
- Focus attention on the most critical sales signals.
- Insight cards
- Surface AI-generated summaries in a format that supports action.
- Status indicators
- Communicate urgency and risk clearly without clutter.
- Task actions
- Keep follow-ups and next steps near the context they relate to.
Final experience
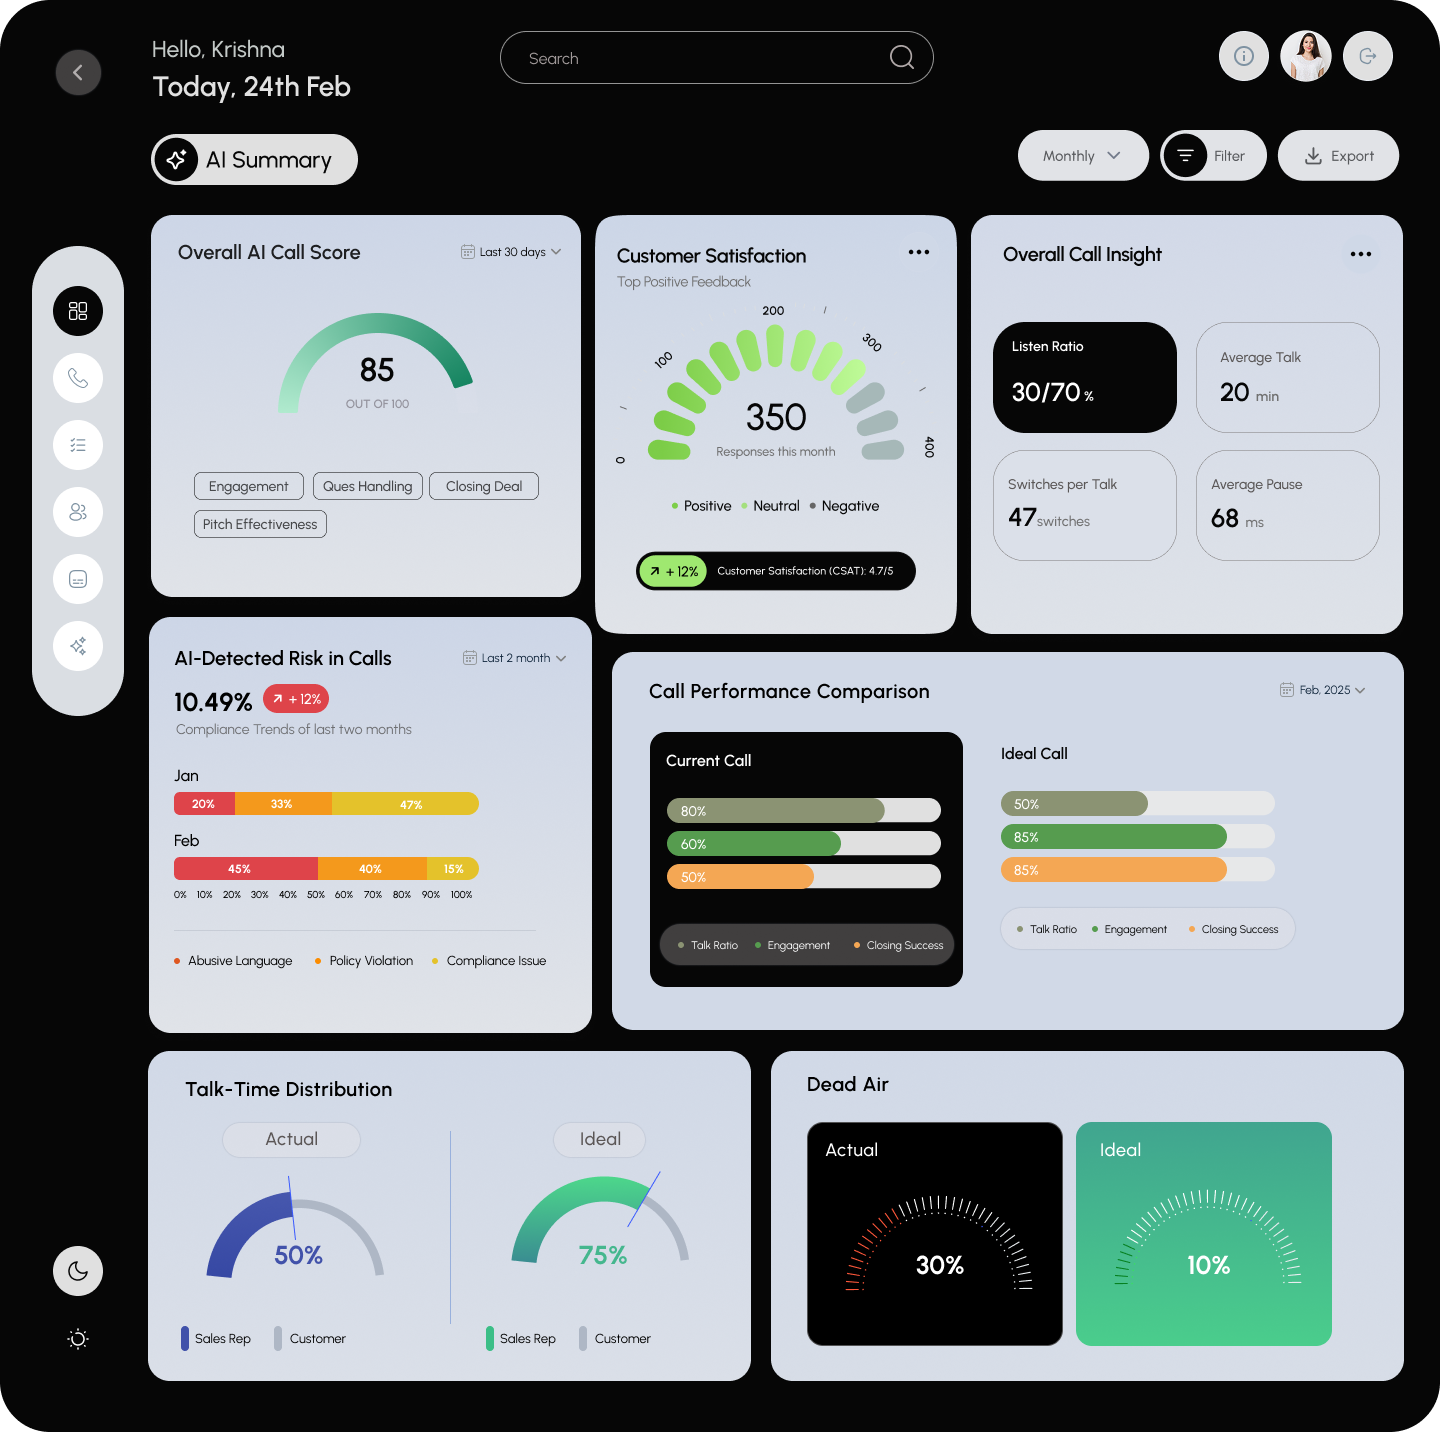
A CRM workspace built for scanning, understanding, and acting.
The final experience brings key sales signals, AI-generated insights, call performance, risks, and follow-up tasks into one unified workspace.
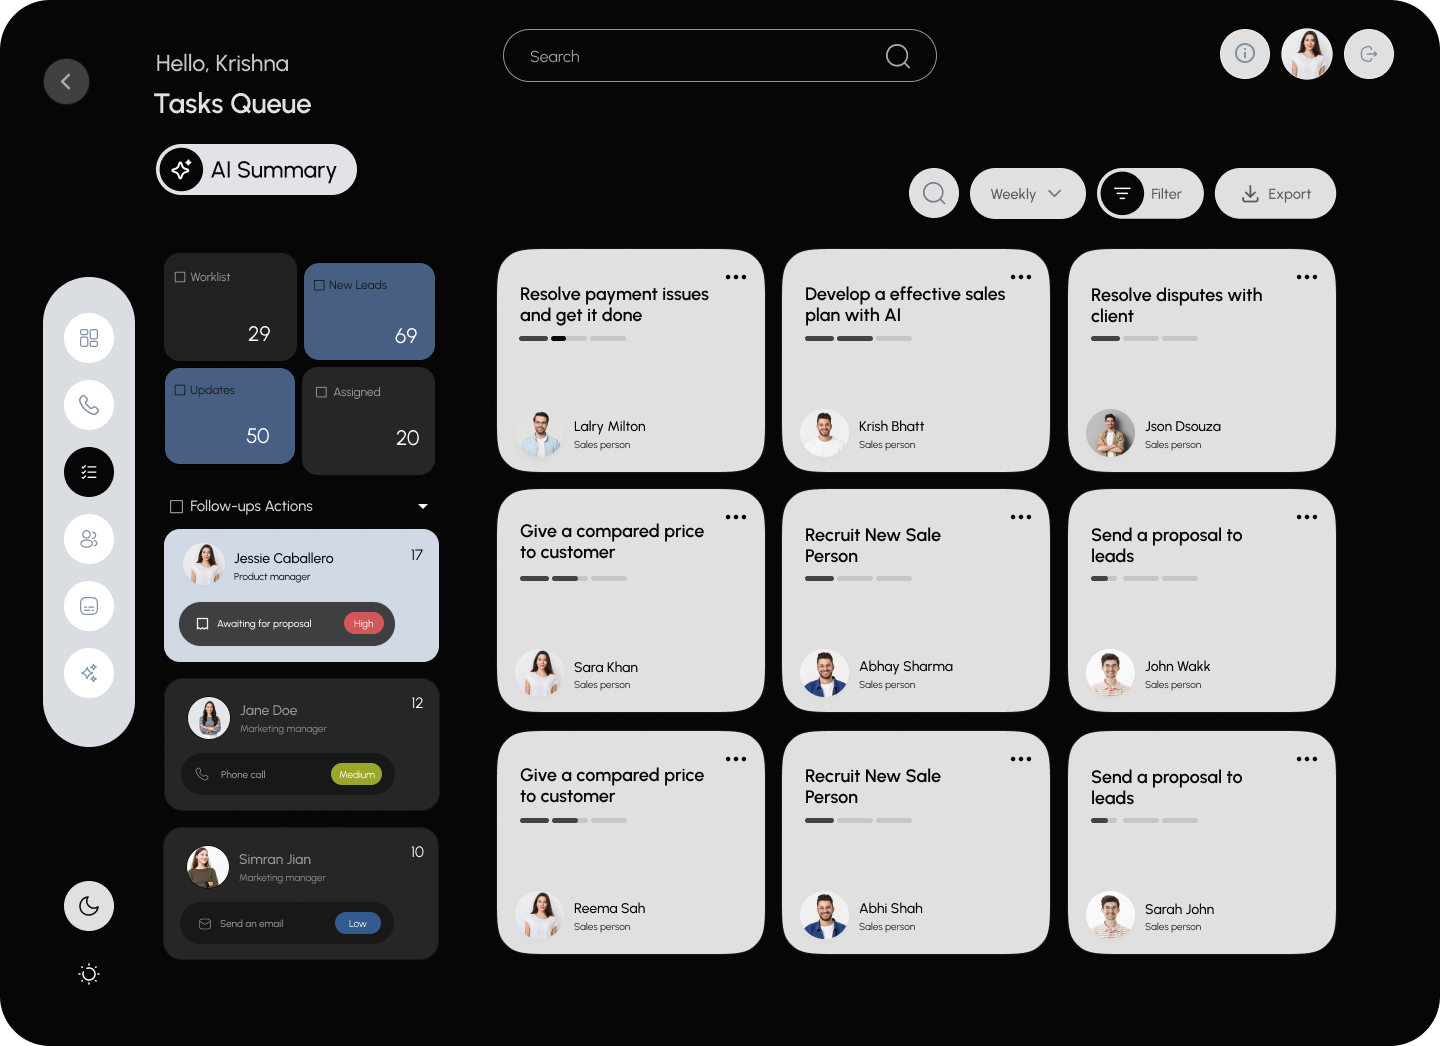
Tasks and follow-ups
The next step is clear, actionable, and close to the signal that triggered it.
Outcome
- Connected high-level signals, AI insights and follow-up actions in one workflow.
- Designed task states and reusable UI patterns for sales teams.
- Concept project, not tested with users.
A CRM workspace built for scanning, understanding, and acting.
What I learned
A good CRM dashboard isn't about showing everything. It's about showing the right thing at the right level of detail.